Oil and natural gas: the price of oil slides to the $74.00
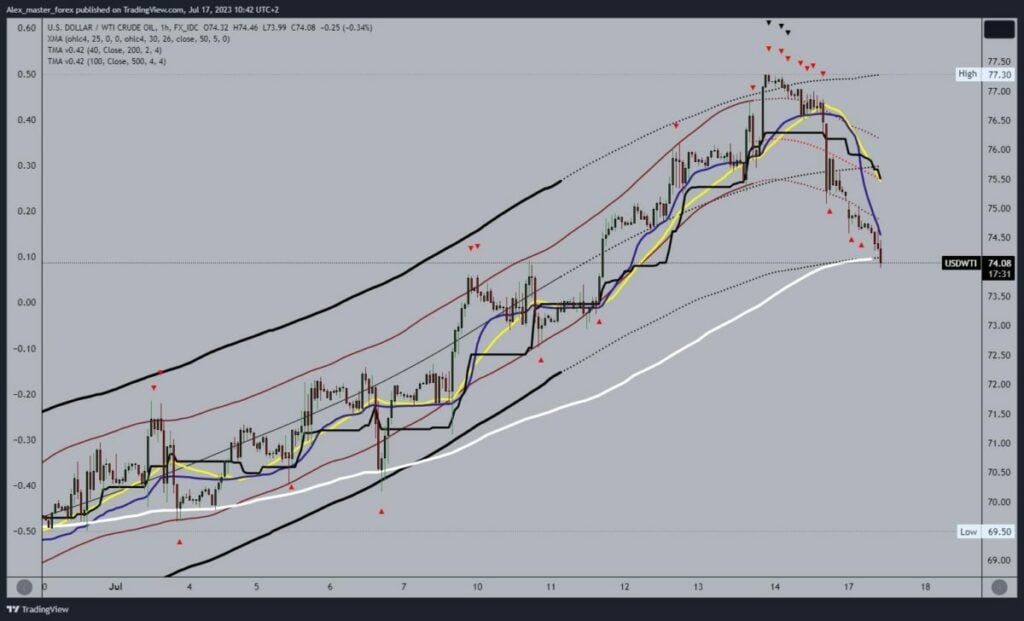
- During the Asian trading session, oil prices continued falling to $74.20 support level.
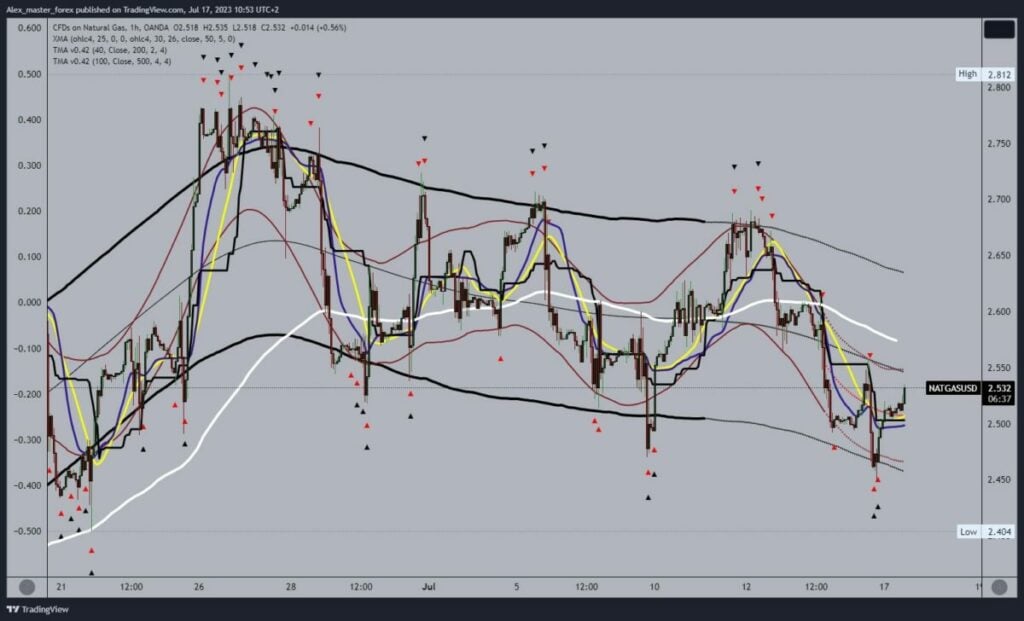
- The price of natural gas fell to $2.45 on Friday, the lowest in the previous 25 days.
Oil chart analysis
During the Asian trading session, oil prices continued falling to $74.20 support level. There, we meet the EMA50 moving average and expect to see its support. If the bearish pressure continues, the drop in oil price is inevitable, and we will probably see it this week.
We need negative consolidation and a drop below the EMA50 for a bearish option. This would put additional pressure on the oil price, which would then have a negative effect on the price level. Potential lower targets are $73.50 and $73.00 levels.
We need a positive consolidation and a move to the $75.00 level for a bullish option. In this way, the price would form a new bottom from which it could start a recovery. Potential higher targets are $75.50 and $76.00 levels.

Natural gas chart analysis
The price of natural gas fell to $2.45 on Friday, the lowest in the previous 25 days. A slight price recovery brought us back to $2.50, and the market closed then. During the Asian session, prices moved slightly above that level, and now we see a bullish impulse and a move to the $2.53 level. This could be the start of this week’s gas price recovery.
For a bullish option, we need a continuation of positive consolidation and growth above the $2.55 level. Then, we need to maintain ourselves up there so that we can start the continuation of the recovery with the next impulse. Potential higher targets are $2.60 and $2.65 levels.
We need a negative consolidation and pullback below the $2.50 level for a bearish option. After that, we could expect to revisit the previous low at the $2.45 level. Potential lower targets are $2.40 and $2.35 levels.

The post Oil and natural gas: the price of oil slides to the $74.00 appeared first on FinanceBrokerage.
